


Sugar Math PowerPoint Show - DOWNLOAD NOW - PPT with speaker's notes and handouts
SKU: ppt-sugmat


FREE SHIPPING - 15% off orders over $25 code: SPRINGSAVE15 - 100% Satisfaction Guarantee
FREE SHIPPING - 15% off orders over $25 code: SPRINGSAVE15 - 100% Satisfaction Guarantee
Are you 18 years old or older?
Sorry, the content of this store can't be seen by a younger audience. Come back when you're older.
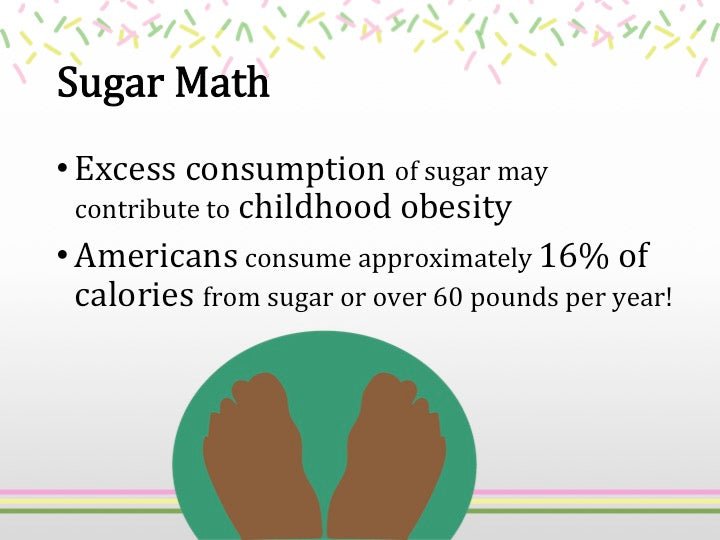
The 2015 Dietary Guidelines for Americans state that the upper limit for sugar should be limited to 10% per person. The American Heart Association further reduces that amount to just 6 teaspoons per person. The average person in the United States consumes about 60 pounds or more of sugar a year, clearly over the limit. And with over two thirds of the adult population in the US being overweight or obese it is now more important than every to limit the consumption of added sugar.
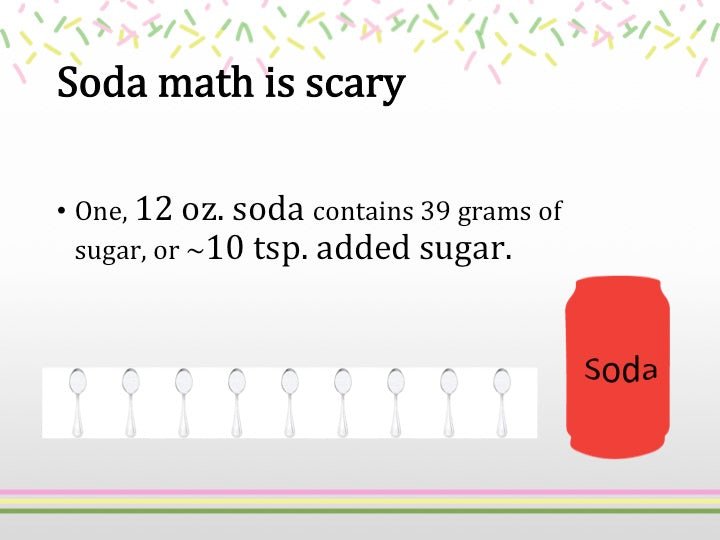
We all know that food and beverage manufacturers use an amazing amount of different sweeteners in foods to make them more shelf stable and palatable to their customers.
Consumers have to learn to be more label literate so they can decipher the manufacturer claims versus what is really in the food they are buying and eating.
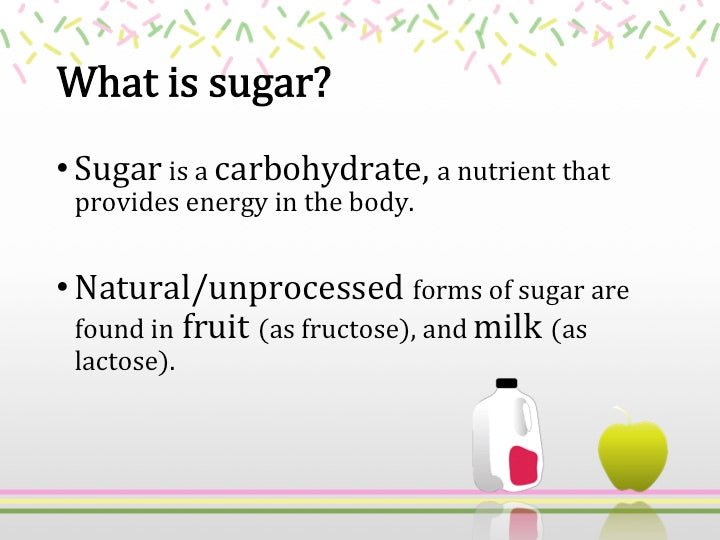
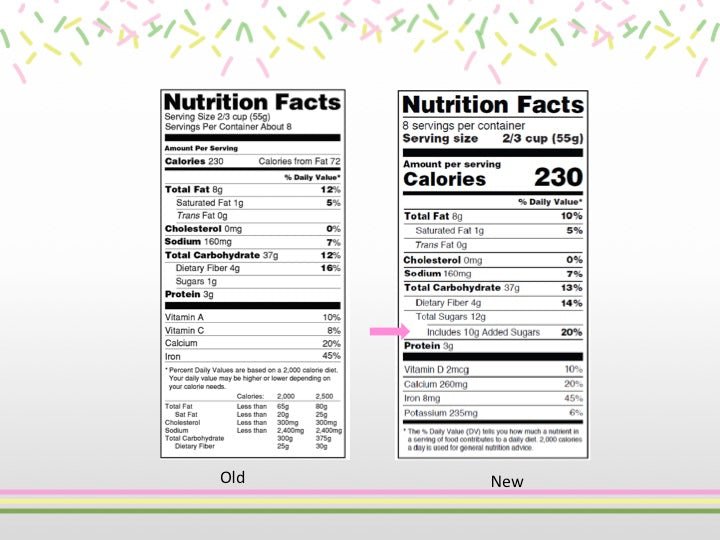
The new food label will show the amount of added sugars. That is very good news indeed! No one has to wonder if the sugar on the label is naturally found in the food or added as part of processing.
However, there is a big disconnect! The sugar on the food label is given in grams.
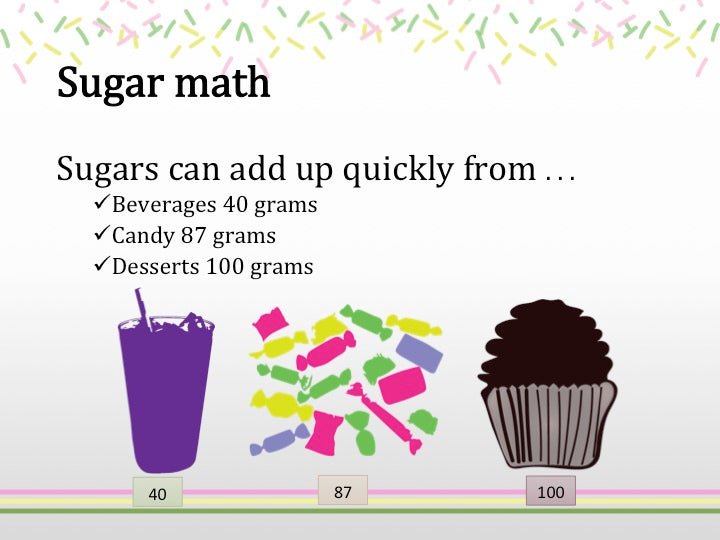
The sugar math show helps people understand the Dietary Guidelines for the limit of sugar and how they fit their own calorie intake. But more importantly, this show helps people calculate a food or drink and the sugar it contains into their own eating plan. They become more aware of how it all adds up too quickly.
Specs:
Use collapsible tabs for more detailed information that will help customers make a purchasing decision.
Ex: Shipping and return policies, size guides, and other common questions.
Subscribe today and get 10% off your first purchase


